Monetization
Revenue tracking answers the business question: is your game making money, and where is it coming from? Quest Data shows you which products sell, who your paying users are, and whether your pricing strategy works.
What You’ll Learn
Section titled “What You’ll Learn”- How to track purchases and see revenue trends
- How to identify your top products and biggest spenders
- How to measure ARPPU and paying user ratios
- How to track subscriptions and ad revenue
- How to evaluate offers and promotions
Revenue Dashboard
Section titled “Revenue Dashboard”The revenue page gives you a bird’s-eye view of your game’s income.
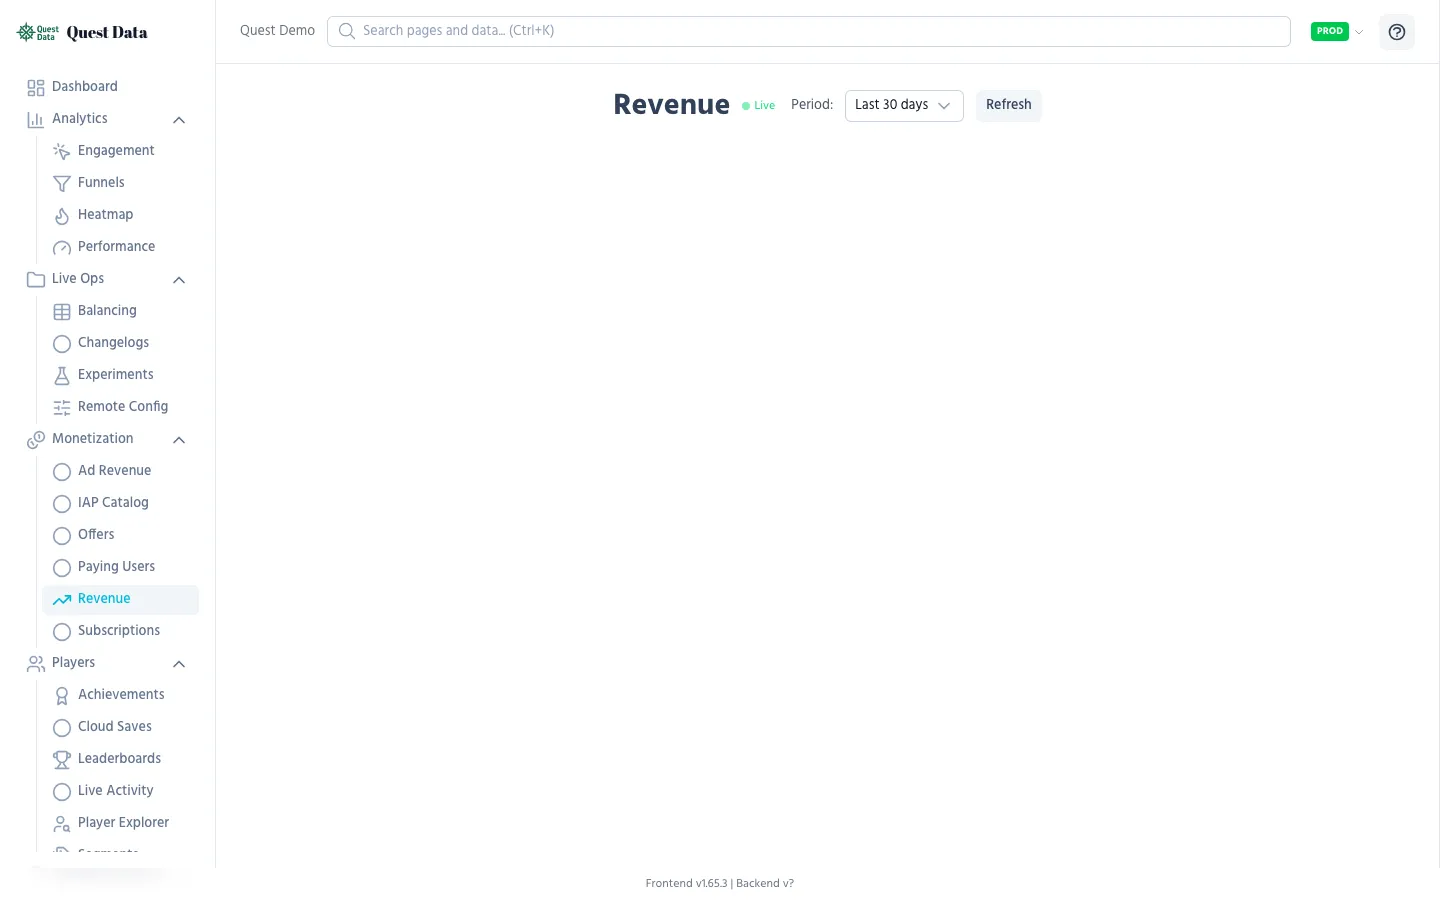
Key metrics:
| Metric | What it tells you | Why it matters |
|---|---|---|
| Total Revenue | Sum of all purchases | Is the game making money? |
| ARPPU | Average Revenue Per Paying User | How much do spenders spend? |
| Top Products | Best-selling items by revenue | What do players want to buy? |
| Daily Revenue | Revenue over time | Is revenue growing or declining? |
SDK integration
Section titled “SDK integration”One line of code per purchase:
QuestData.track_purchase("starter_pack", 4.99, "USD")See Purchase Tracking Reference for all parameters.
IAP Catalog
Section titled “IAP Catalog”The IAP Catalog shows every product you sell with conversion rates and buyer insights.
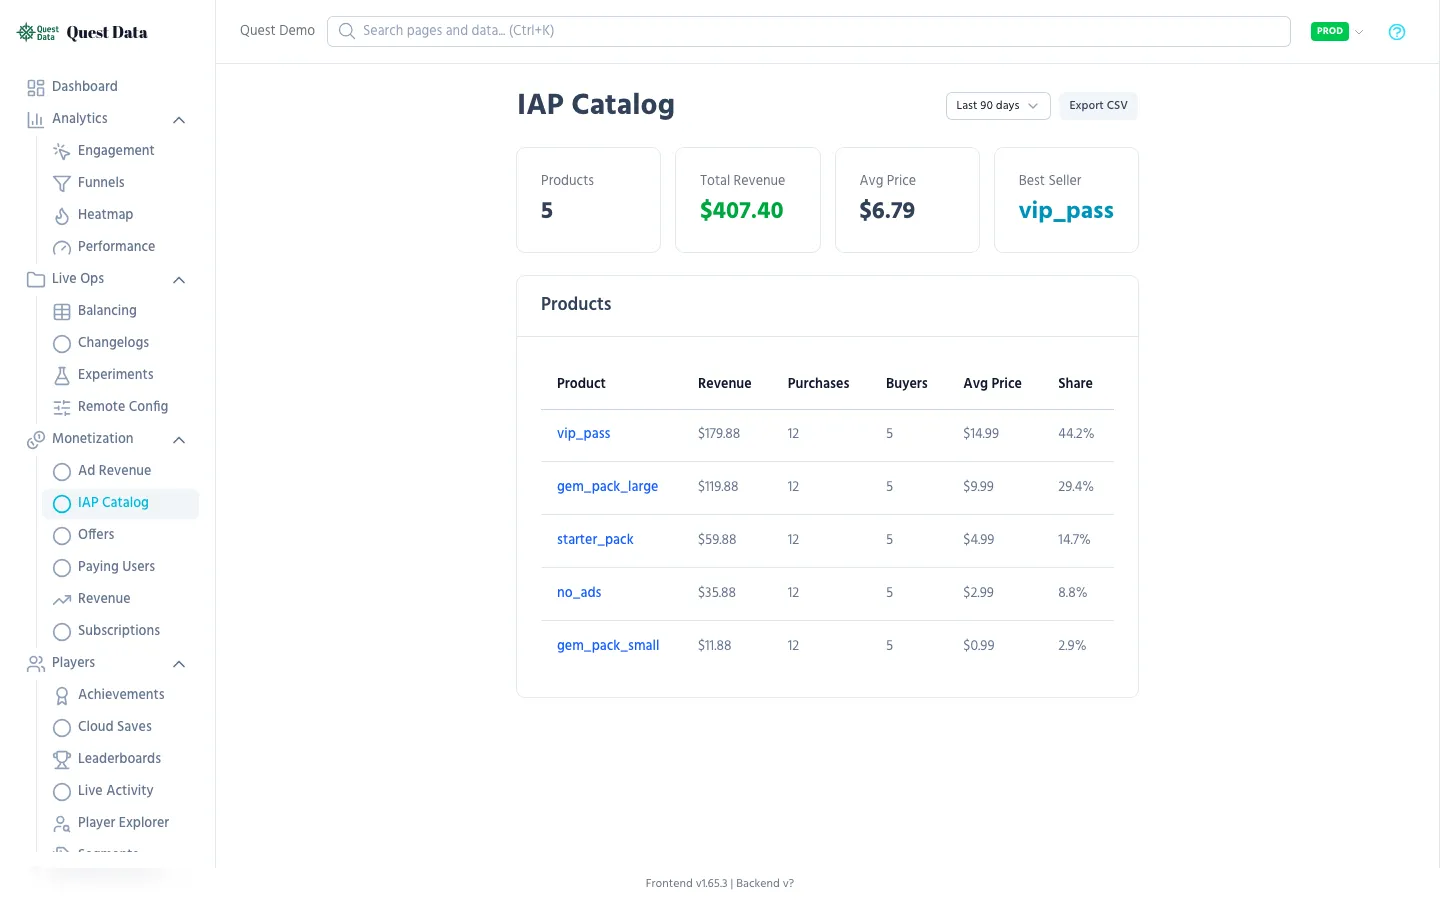
| Column | What it means |
|---|---|
| Product ID | Your store product identifier |
| Revenue | Total revenue from this product |
| Purchases | Number of times bought |
| Unique Buyers | Distinct players who bought it |
| Conversion Rate | Buyers / players who saw the shop |
Actionable insights:
- High views, low conversion? → Price too high or value unclear
- Low views, high conversion? → Product is hidden but desirable — promote it
- One product dominates revenue? → Diversify your catalog
Paying Users
Section titled “Paying Users”Understand who spends money and how much.
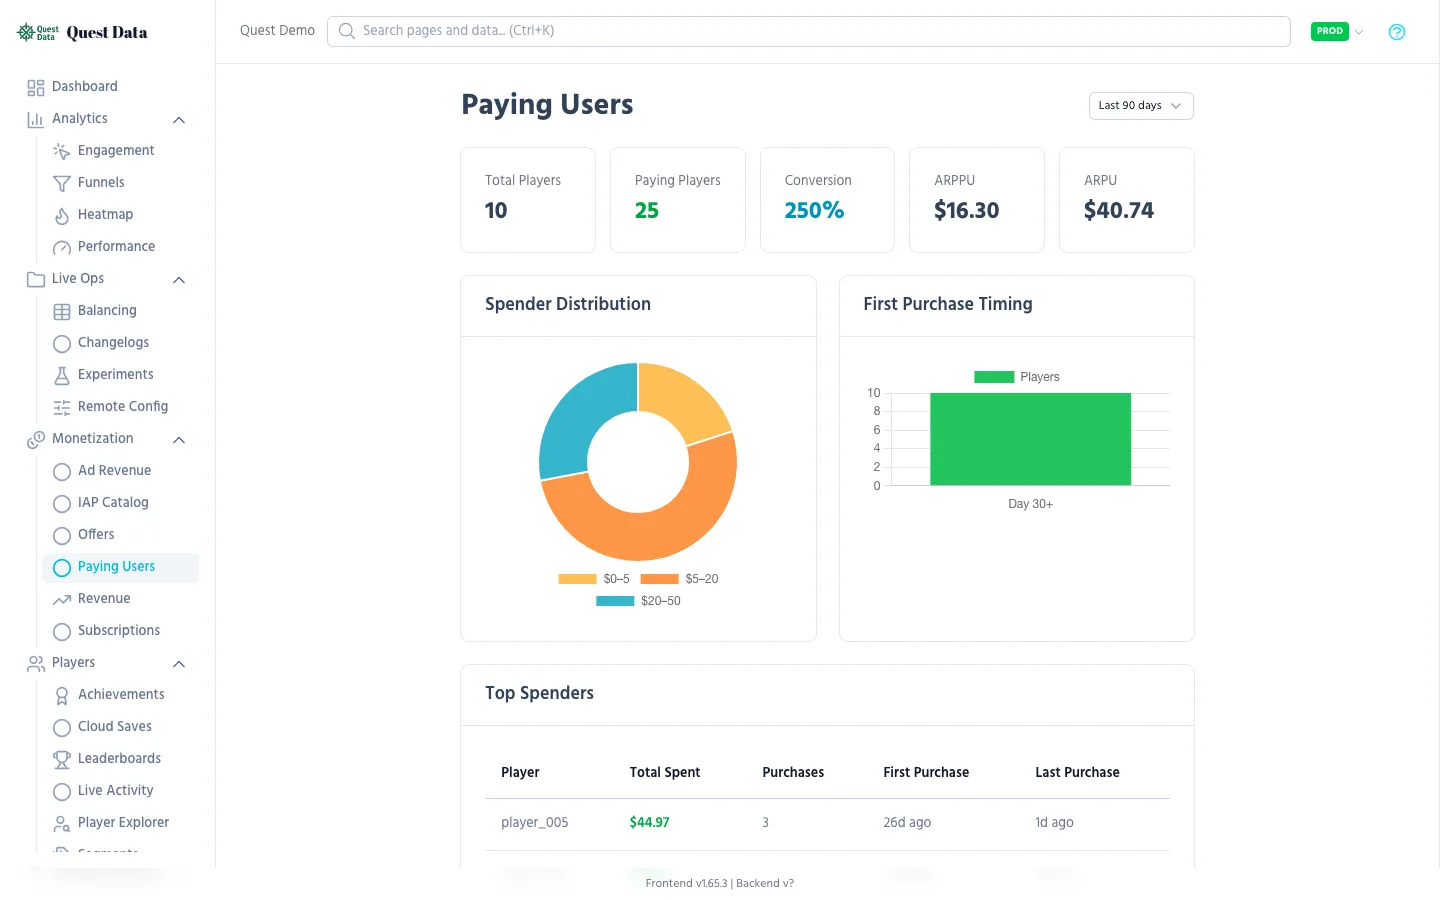
| Metric | What it tells you |
|---|---|
| Paying Ratio | % of players who ever spent money (typical: 2-5%) |
| First Purchase Timing | How many sessions before first spend |
| Whale Detection | Players who spend disproportionately (top 1% of spenders) |
| Spending Tiers | Minnow / Dolphin / Whale distribution |
What to do:
- First purchase takes too long? → Better early offers or starter packs
- Too few paying users? → Monetization is too aggressive or value is unclear
- One whale accounts for 50% of revenue? → Dangerous concentration risk
Subscriptions
Section titled “Subscriptions”Track Battle Pass, premium memberships, or any recurring payment.
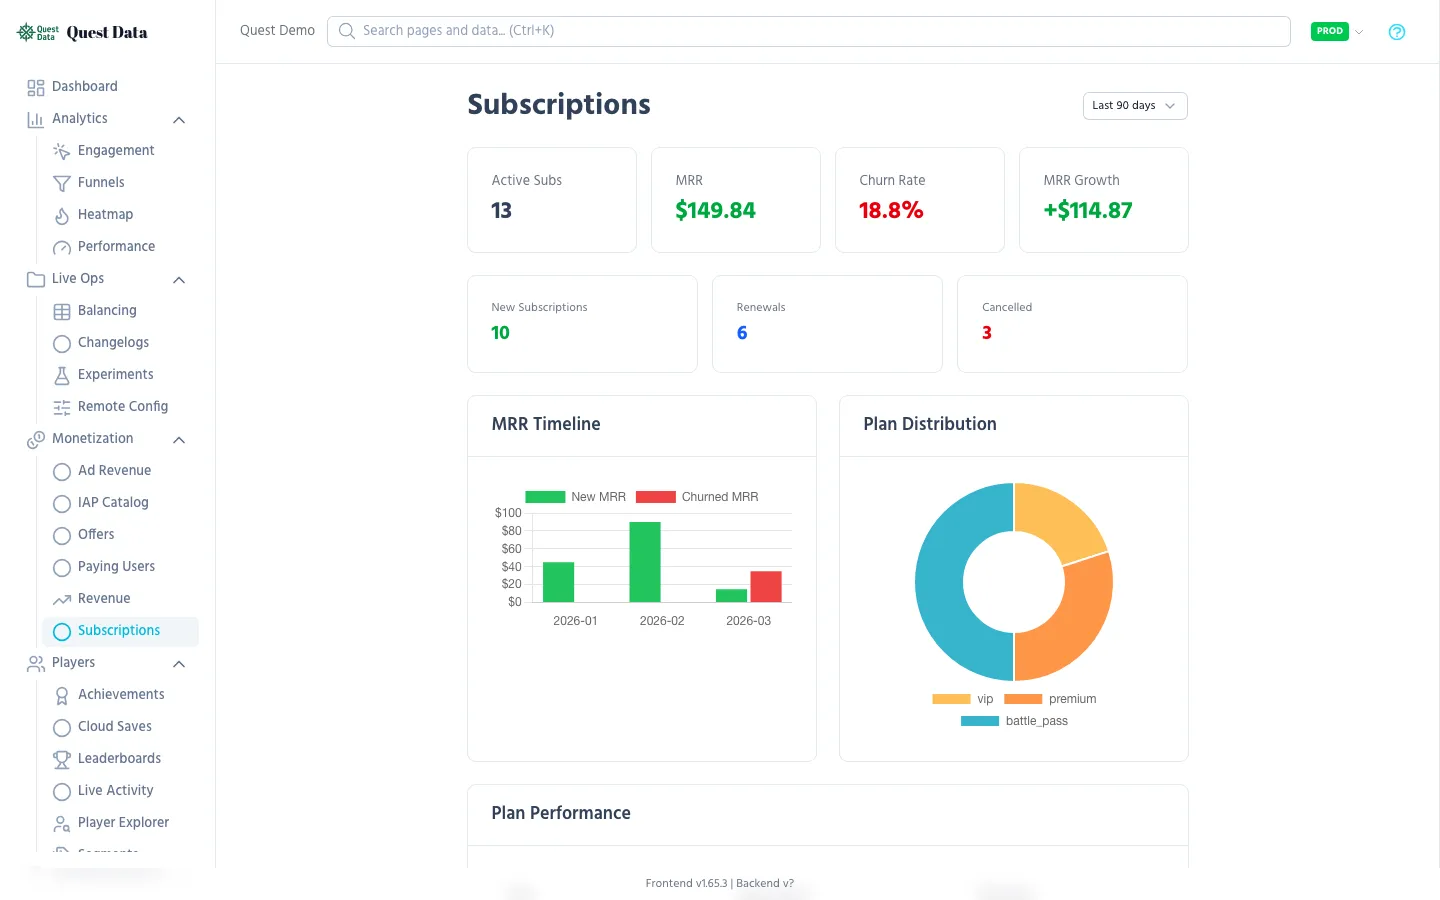
Key metrics:
- MRR (Monthly Recurring Revenue) — predictable income
- Churn Rate — % of subscribers who cancel
- Renewal Rate — % who auto-renew
- New vs. Cancelled — Net growth
SDK integration
Section titled “SDK integration”QuestData.track("subscription_started", { "product_id": "battle_pass_s3", "price": 9.99, "duration_days": 30})Offers & Promotions
Section titled “Offers & Promotions”Measure whether your sales and special offers actually work.
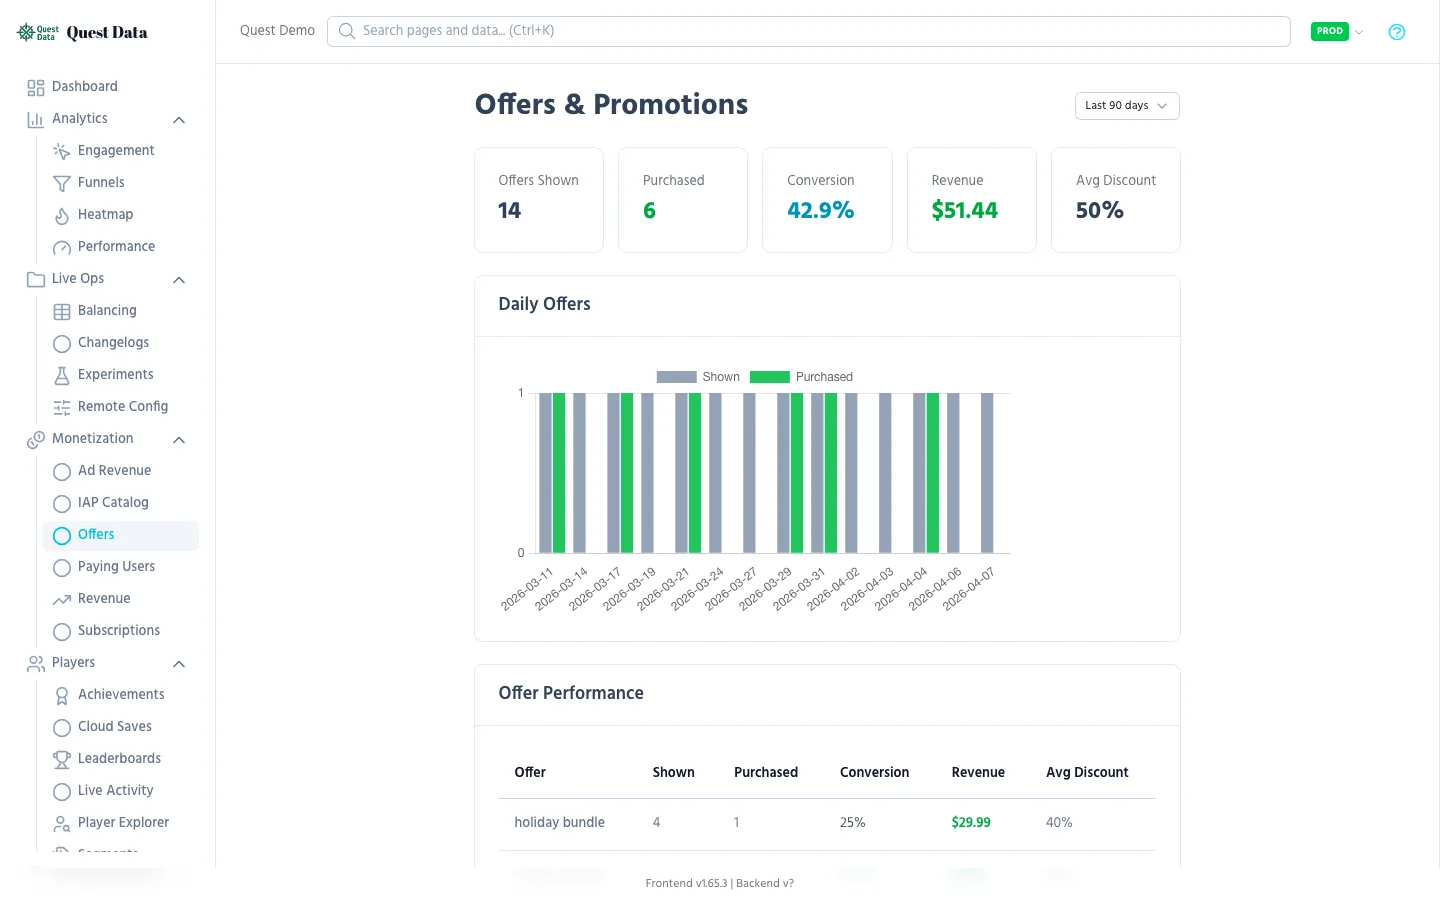
Track offer events:
# Player sees an offerQuestData.track("offer_shown", {    "offer_id": "weekend_sale",    "discount_percent": 50})
# Player buys the offerQuestData.track_purchase("weekend_sale_pack", 2.49, "USD", {    "offer_id": "weekend_sale",    "original_price": 4.99})
Ad Revenue
Section titled “Ad Revenue”If your game shows ads, track impressions and revenue per placement.
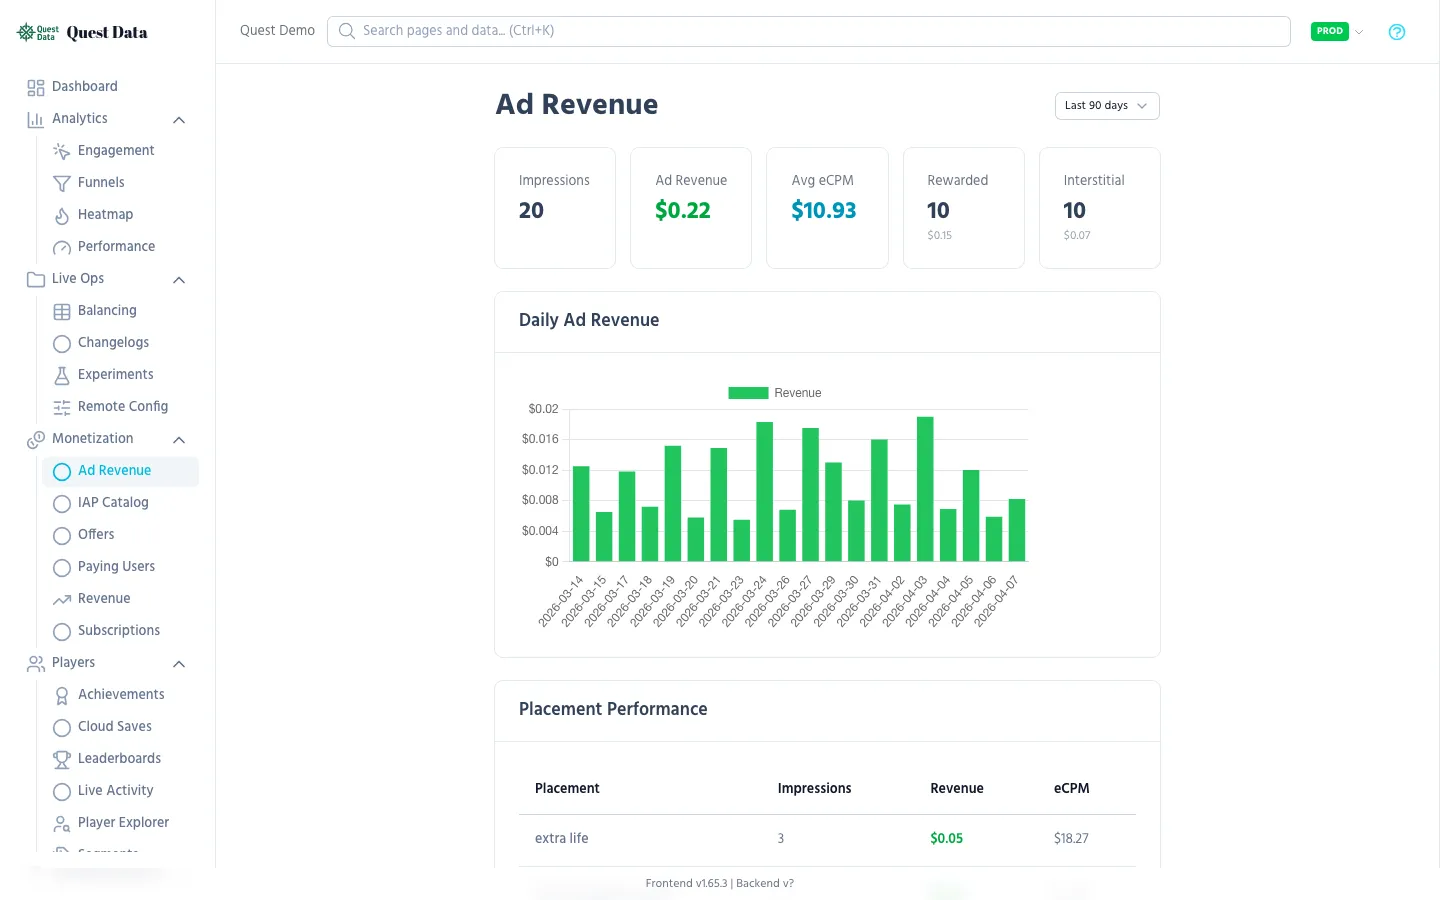
QuestData.track("ad_watched", { "ad_type": "rewarded", "placement": "revive_screen", "reward_type": "coins", "reward_amount": 100})Watch for ad-to-IAP cannibalization — if ad revenue goes up but IAP revenue drops, your ads might be too generous.
Next Steps
Section titled “Next Steps”- Purchase Tracking SDK Reference — Full API documentation
- Revenue Dashboard Reference — Detailed metric explanations
- IAP Catalog Reference — Product-level analytics
- Analytics Guide — Player behavior insights